
Reads with SET STATISTICS IO
The plan shows the strategy chosen to answer a query. SET STATISTICS IO adds another piece of evidence: how many pages SQL Server read from each object during that execution.
A page is the basic unit SQL Server uses to organize data and indexes. It normally holds 8 KB. The counter records page accesses, not returned rows or megabytes transferred to the client.
Enable the measurement
The option applies to the current session and writes its output to Messages:
SET STATISTICS IO ON;

DECLARE @Desde DATE = '2025-12-30';

SELECT COUNT_BIG(*) AS Pedidos
FROM dbo.PedidoLaboratorio AS p
WHERE p.FechaPedido >= @Desde;

SET STATISTICS IO OFF;
Run the complete block with F5. SSMS opens Results with the count and Messages with the Table, Scan count, logical reads, physical reads, and read-ahead reads lines. To relate the measurement to its strategy, enable Include Actual Execution Plan with Ctrl+M before execution and open Execution plan afterward.
ON remains active for later statements in the same session until OFF is executed or the connection closes. Disable it when the measurement is complete so results from unrelated queries are not mixed together.
The output is organized by object
The test compares two queries that return the same count. The first compares the indexed column directly; the second transforms that column with DATEDIFF.
DECLARE @Desde DATE = '2025-12-30';

SELECT COUNT_BIG(*) AS Pedidos
FROM dbo.PedidoLaboratorio AS p
WHERE p.FechaPedido >= @Desde;

SELECT COUNT_BIG(*) AS Pedidos
FROM dbo.PedidoLaboratorio AS p
WHERE DATEDIFF(DAY, @Desde, p.FechaPedido) >= 0;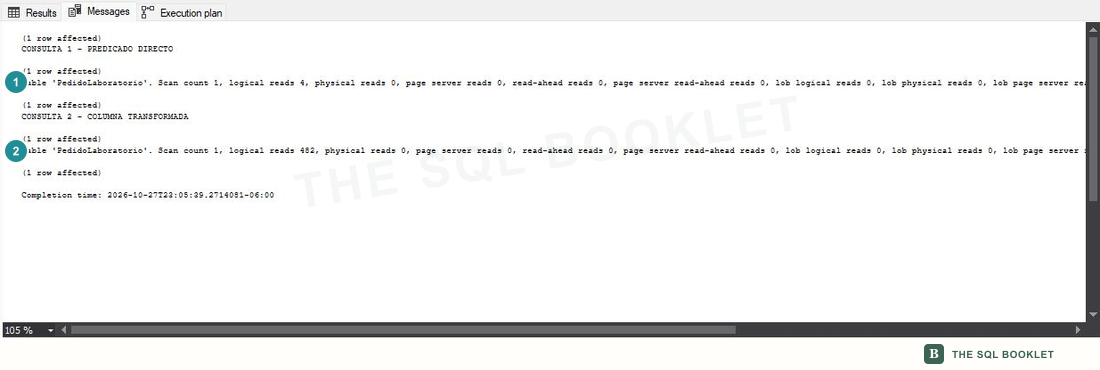
- 1Direct predicate
PedidoLaboratorioreportsscan count 1,logical reads 4, andphysical reads 0. - 2Transformed column
The same object reports
scan count 1, but logical reads rise to482. Both queries returned136orders.
A query may show several lines when it accesses several tables, internal indexes, or work structures. Relate each line to its object and the corresponding plan branch before adding counters together.
logical reads: pages obtained from the cache
A logical read occurs when the engine requests a page from the buffer pool, the memory where SQL Server keeps recently used pages. The counter includes every requested access during execution, so it does not necessarily represent unique pages.
In this test, 4 versus 482 establishes that the second strategy traversed many more pages from the same object. It does not yet tell us elapsed time, CPU consumption, or whether the difference matters to the workload as a whole.
physical reads: pages that were not already in memory
A physical read occurs when a requested page is unavailable in the cache and must be obtained from storage. Both queries report physical reads 0: the required pages were already in memory during this execution.
Zero does not mean that the query performed no work. The logical reads are still present. Clearing the cache on a shared instance merely to force physical reads is also inappropriate: it changes the conditions for other sessions and is outside this check.
read-ahead reads: pages requested in advance
Read-ahead lets SQL Server request pages before an operator reaches them when the engine anticipates a traversal. The counter was 0 in this test. It may change in another execution because of the plan, access size, cache contents, and instance state.
The lob logical reads, lob physical reads, and lob read-ahead reads counters apply to large-object data when the query uses it. They remain zero here because the access does not require LOB columns.
scan count is not the operator name
scan count counts access starts against the object. It does not count pages, rows, or occurrences of the word Scan in the plan. Both queries therefore report scan count 1 even though one uses an Index Seek and the other uses an Index Scan.
The value can reveal repeated accesses, but it needs context. One access may start once and read many pages; another may start many times inside Nested Loops and read only a few pages per execution.
Relate the reads to the plan
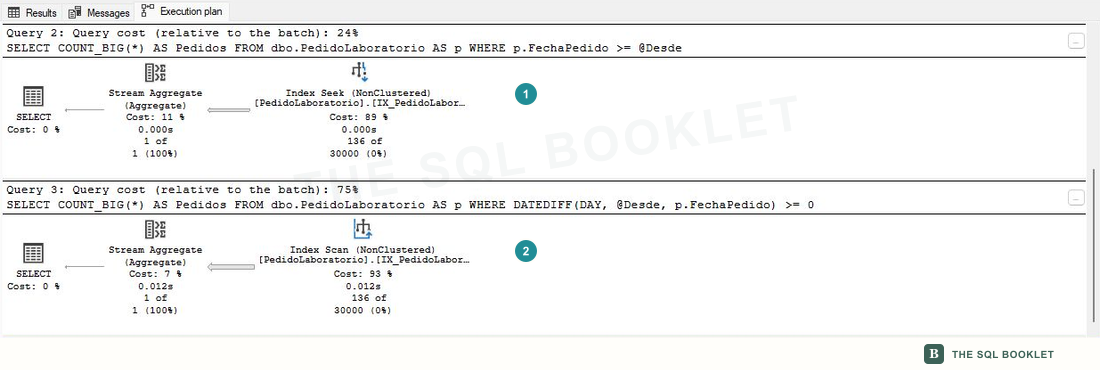
- 1
Index SeekThe direct predicate lets the access begin at the relevant range in
IX_PedidoLaboratorio_FechaPedido. Its measurement was four logical reads. - 2
Index ScanDATEDIFFtransforms eachFechaPedidovalue before comparison. SQL Server traverses the index, and the measurement rises to 482 logical reads.
The plan explains how the object was accessed; STATISTICS IO measures part of the read work produced by that access. Neither source replaces the other.
Compare equivalent queries
For the difference to be useful, both queries must return the same result and run under comparable conditions. In this test both count 136 orders, but they do not perform the same work.
There is no universal “correct” number of reads. It depends on the requested result, volume, indexes, and data distribution. The strongest comparison starts from the same query or two equivalent forms, preserves parameters, and records the execution conditions.
What we can conclude
Transforming the column changed the access from Index Seek to Index Scan and raised logical reads from 4 to 482 in this execution. That difference alone cannot be converted into elapsed time, CPU, concurrent impact, or a universal recommendation.
A reasonable next check
The next entry adds SET STATISTICS TIME to separate CPU time from elapsed time. We can then relate read work to observed duration without assuming that both measurements mean the same thing.