
Walk through Analyze Actual Execution Plan
Analyze Actual Execution Plan reviews an actual plan and highlights patterns that SSMS recognizes in the observed execution. The tool helps locate a point that deserves investigation; it does not confirm the cause or decide which change should be applied.
This query reproduces the case used in the captures:
DECLARE @Desde DATE = '2025-12-30';

SELECT
    p.Estado,
    COUNT_BIG(*) AS Pedidos,
    SUM(p.Total) AS ImporteTotal,
    AVG(p.Total) AS ImportePromedio
FROM dbo.PedidoLaboratorio AS p
WHERE p.FechaPedido >= @Desde
GROUP BY p.Estado
ORDER BY ImporteTotal DESC;
The analysis requires an actual plan
Enable Include Actual Execution Plan with Ctrl+M, run the query, and open Execution plan. Then right-click the canvas and choose Analyze Actual Execution Plan.
An actual plan preserves estimates and adds execution measurements, such as observed rows. That comparison lets SSMS look for scenarios where the prediction and the observed result diverged. The analysis does not replace the plan: it opens the Showplan Analysis panel and keeps the plan as the source of evidence.
The query groups recent orders by status, counts their rows, calculates the total and average amount, and sorts the groups by amount. The plan combines Index Seek, Hash Match (Aggregate), Compute Scalar, and Sort. At the initial access, SQL Server estimated 30000 rows and observed 136. This is the same difference examined when comparing estimated and actual rows; now we will see how the tool presents it inside a plan with more operations.
Multi Statement chooses the statement to analyze
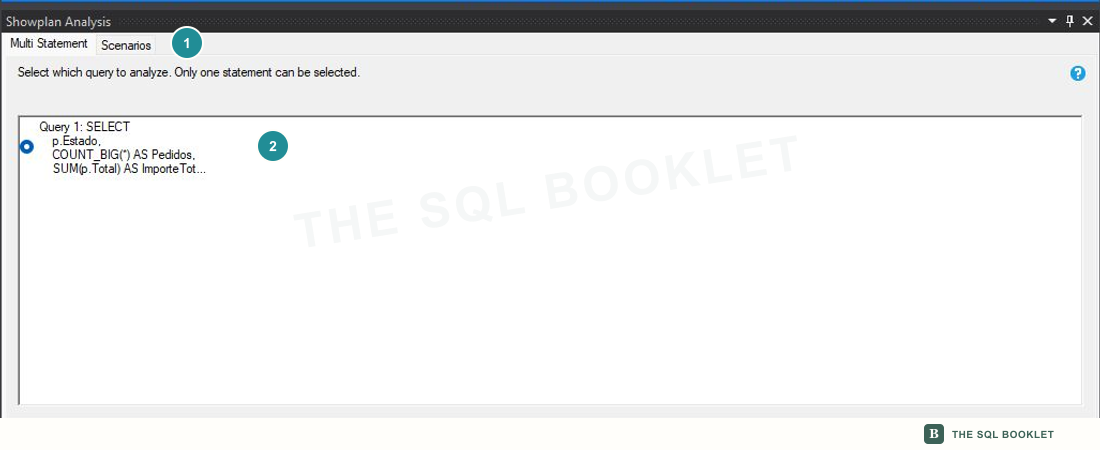
- 1
Multi StatementLists the statements available in the plan and allows one of them to be selected for analysis.
- 2Selected query
The radio button identifies the active statement. In a batch with several queries, confirm the text before interpreting the scenarios.
A batch is the set of statements sent to SQL Server together. Even though this plan contains one query, SSMS keeps the selection step because a plan can contain several.
Changing the selection does not execute the query again. It changes which statement in the open document the panel examines.
Scenarios groups the patterns found
After choosing the statement, the Scenarios tab shows categories of potential issues SSMS recognized for it.
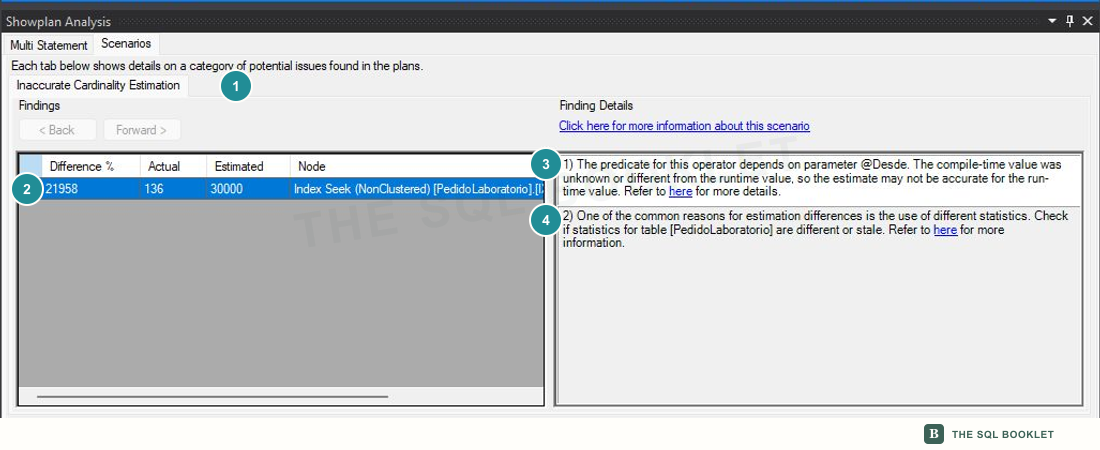
- 1Category found
Inaccurate Cardinality Estimationmeans that the estimate and the observed quantity diverged at an operator. - 2Finding
The row connects the difference to the
Index Seekand shows `136` actual rows versus `30000` estimated rows. - 3Value available at compilation
SSMS notes that the predicate depends on
@Desdeand that the value known during compilation may have been unknown or different from the value used at runtime. - 4Statistics
The second possibility asks whether the table statistics are different or stale.
The Difference % column shows 21958. That percentage expresses the separation calculated by the tool; it is not operator cost, a performance loss, or a universal severity threshold.
The node identifies where SSMS observed the difference. It does not mean the Index Seek is defective. The operator remains the point where both quantities are compared; the explanation may depend on the predicate, parameters, statistics, or data distribution.
Finding Details proposes investigation paths
A possible explanation indicates where to seek additional evidence. It does not state that both conditions exist or that either is the confirmed cause. In this test, the local variable makes it relevant to inspect what information the optimizer had while estimating; the statistics note remains a hypothesis until dates, modifications, and distribution are checked.
The here links open general documentation for the scenario. They do not inspect this database history or validate a query-specific correction.
Keep the signal separate from the decision
The reading can be recorded in three parts:
- Observation: the
Index Seekestimated30000rows and produced136in this execution. - Suggested hypotheses: the value available during compilation or the statistics might contribute to the difference.
- Pending verification: measure the work performed and inspect each hypothesis before changing the query, statistics, or indexes.
Updating statistics, adding OPTION (RECOMPILE), or changing code only because an explanation mentions it would turn a clue into an automatic correction. Each alternative has effects and requires its own test.
What the tool does not guarantee
Analyze Actual Execution Plan works with the scenarios recognized by the installed SSMS version. An empty panel does not prove the plan is free of problems. A scenario also does not establish its impact on CPU, reads, duration, or concurrency.
The tool analyzes the open document. It does not compare historical executions, representative parameter sets, or different load conditions by itself. Its wording and categories can also vary between SSMS versions.
What we can conclude
We can select the correct statement, locate the operator associated with the finding, and turn SSMS explanations into specific questions. We still cannot choose a correction: first we need to measure the work and verify which hypothesis describes this execution.
A reasonable next check
The next entry uses SET STATISTICS IO to measure pages read and scan counts. That evidence will let us relate the detected scenario to the work SQL Server performed to answer the query.
Related
- Estimated rows and actual rows: interpret the difference shown by this scenario.
- Actions available in the SSMS graphical plan: locate analysis among the canvas actions.
- How Showplan XML is organized: locate the node and its measurements inside the document.
- Review statistics: collect evidence before accepting a statistics-related explanation.