
History and regressions with Query Store
The plan visible in one execution cannot explain how the query behaved yesterday or which strategy it used in another interval. Query Store persists query text, plans, and runtime statistics in the database so those changes can be related over time.
What Query Store preserves
Query Store organizes the evidence around a query identified by query_id, one or more strategies identified by plan_id, and runtime statistics aggregated into intervals.
It is not the plan cache. The cache supports plan reuse and may evict entries; Query Store persists history according to its capture, retention, and storage configuration.
Enabling it is a database decision
ALTER DATABASE TestDatabase
SET QUERY_STORE = ON;

ALTER DATABASE TestDatabase
SET QUERY_STORE
(
    OPERATION_MODE = READ_WRITE,
    QUERY_CAPTURE_MODE = ALL,
    INTERVAL_LENGTH_MINUTES = 1,
    MAX_STORAGE_SIZE_MB = 100
);
Replace TestDatabase with the name of the database designated for this test.
This configuration is for a small test. A real database needs explicit capture, retention, maximum size, cleanup, and state monitoring. Compare desired_state_desc with actual_state_desc; Query Store may stop capturing after reaching a limit or encountering a problem.
Generate two plans in a test database
The following block temporarily disables IX_PedidoLaboratorio_FechaPedido, runs the same statement text, and rebuilds the index before it finishes. Use it only in a test database where that index and dbo.PedidoLaboratorio were created for this check. Do not run it against an operational database.
DECLARE @Consulta nvarchar(max) = N'
DECLARE @Desde date = ''2025-12-30'';

SELECT COUNT_BIG(*) AS Pedidos
FROM dbo.PedidoLaboratorio AS p
WHERE p.FechaPedido >= @Desde;';

DECLARE @Ejecucion tinyint = 1;

BEGIN TRY
    -- First group: the date index is available.
    WHILE @Ejecucion <= 5
    BEGIN
        EXEC sys.sp_executesql @Consulta;
        SET @Ejecucion += 1;
    END;

    ALTER INDEX IX_PedidoLaboratorio_FechaPedido
        ON dbo.PedidoLaboratorio DISABLE;

    -- Second group: the same text compiles without that index.
    SET @Ejecucion = 1;

    WHILE @Ejecucion <= 5
    BEGIN
        EXEC sys.sp_executesql @Consulta;
        SET @Ejecucion += 1;
    END;

    ALTER INDEX IX_PedidoLaboratorio_FechaPedido
        ON dbo.PedidoLaboratorio REBUILD;

    -- Third group: verify the restored environment.
    SET @Ejecucion = 1;

    WHILE @Ejecucion <= 5
    BEGIN
        EXEC sys.sp_executesql @Consulta;
        SET @Ejecucion += 1;
    END;
END TRY
BEGIN CATCH
    IF EXISTS
    (
        SELECT 1
        FROM sys.indexes
        WHERE object_id = OBJECT_ID(N'dbo.PedidoLaboratorio')
          AND name = N'IX_PedidoLaboratorio_FechaPedido'
          AND is_disabled = 1
    )
    BEGIN
        ALTER INDEX IX_PedidoLaboratorio_FechaPedido
            ON dbo.PedidoLaboratorio REBUILD;
    END;

    THROW;
END CATCH;

EXEC sys.sp_query_store_flush_db;
The TRY/CATCH protects index restoration if an execution fails. Even with that protection, disabling an index changes the available structure and may block concurrent work, so this block belongs only in a controlled test.
Query and plan IDs answer different questions
query_id represents the query grouped by Query Store. plan_id identifies a strategy associated with it. Two plan IDs do not prove a regression: relate each plan to its interval, execution count, and observed metrics.
The test runs the same query with its index available, temporarily disabled, and rebuilt. The operation is restricted to the test database and the index is restored even if an error occurs.
Intervals aggregate several executions
The grid shown in the screenshot is produced by running the following query and opening Results:
SELECT
    actual_state_desc AS ActualState,
    desired_state_desc AS DesiredState,
    current_storage_size_mb AS CurrentStorageMB,
    max_storage_size_mb AS MaximumStorageMB,
    interval_length_minutes AS IntervalMinutes
FROM sys.database_query_store_options;

SELECT
    q.query_id AS QueryId,
    p.plan_id AS PlanId,
    rsi.start_time AS IntervalStart,
    rsi.end_time AS IntervalEnd,
    SUM(rs.count_executions) AS Executions,
    CONVERT
    (
        decimal(12, 2),
        SUM(rs.avg_duration * rs.count_executions)
            / NULLIF(SUM(rs.count_executions), 0) / 1000.0
    ) AS AverageDurationMs,
    CONVERT
    (
        decimal(12, 2),
        SUM(rs.avg_cpu_time * rs.count_executions)
            / NULLIF(SUM(rs.count_executions), 0) / 1000.0
    ) AS AverageCpuMs,
    CONVERT
    (
        decimal(12, 2),
        SUM(rs.avg_logical_io_reads * rs.count_executions)
            / NULLIF(SUM(rs.count_executions), 0)
    ) AS AverageLogicalReads
FROM sys.query_store_query_text AS qt
INNER JOIN sys.query_store_query AS q
    ON q.query_text_id = qt.query_text_id
INNER JOIN sys.query_store_plan AS p
    ON p.query_id = q.query_id
INNER JOIN sys.query_store_runtime_stats AS rs
    ON rs.plan_id = p.plan_id
INNER JOIN sys.query_store_runtime_stats_interval AS rsi
    ON rsi.runtime_stats_interval_id = rs.runtime_stats_interval_id
WHERE REPLACE(REPLACE(qt.query_sql_text, CHAR(13), N''), CHAR(10), N' ')
    = N'(@Desde date)SELECT COUNT_BIG(*) AS Pedidos FROM dbo.PedidoLaboratorio AS p WHERE p.FechaPedido >= @Desde'
  AND q.query_id IN
  (
      SELECT q2.query_id
      FROM sys.query_store_query AS q2
      INNER JOIN sys.query_store_plan AS p2
          ON p2.query_id = q2.query_id
      GROUP BY q2.query_id
      HAVING COUNT(DISTINCT p2.plan_id) > 1
  )
GROUP BY
    q.query_id,
    p.plan_id,
    rsi.start_time,
    rsi.end_time
ORDER BY
    q.query_id,
    p.plan_id,
    rsi.start_time;
Run the block with F5 and open Results. The first grid shows Query Store state, and the second groups plans by interval. query_id, plan_id, timing, and interval values belong to each database and may differ from the screenshot. The reproducible observation is that one query can retain more than one plan and that each row records the executions and measurements contributing to an interval.
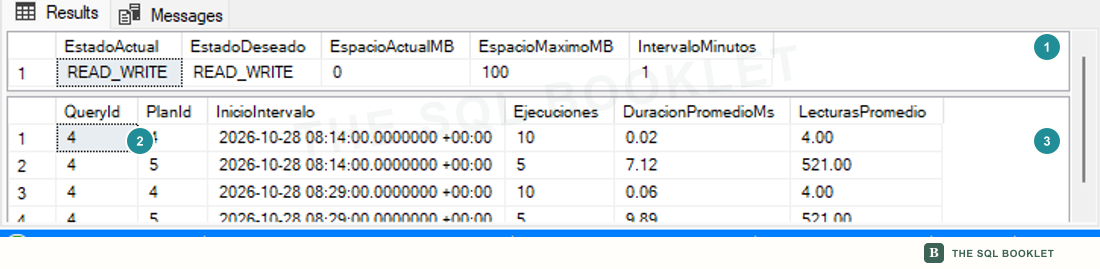
- 1Capture state
READ_WRITEconfirms that actual and desired states match. The test uses a 100 MB limit and one-minute intervals. - 2Two plans
query_id4 retainsplan_id4 and 5 in the test intervals. - 3Observed work
Plan 4 averages 4 logical reads; plan 5 averages 521. Average duration also increases and must be read together with the execution count.
Each row summarizes several executions. An average can hide extremes; count_executions records how many observations contributed.
When to call a change a regression
A regression is a relative deterioration against a comparable reference. It requires an earlier condition, a later condition, and a metric whose change matters for the workload.
Here plan 5 performs 521 reads compared with 4 for plan 4 and shows a higher average duration. The difference is deliberate and repeatable, but it does not mean every new plan is a regression. Parameters, volume, execution count, concurrency, and result still matter.
Walk through the report in SSMS
In Object Explorer, expand the database used for the test and then Query Store → Tracked Queries. Enter the query_id returned by the previous query in Tracking query and run the report. That screen displays plans and measurements; it is not the T-SQL grid shown in the screenshot, but another view of the same history.
Regressed Queries, Overall Resource Consumption, and Queries With High Variation offer other entry points. Their names and layout may vary between SSMS versions.
Force Plan and Unforce Plan change database behavior. They are outside this check: forcing requires compatibility, parameter, stability, and rollback validation.
Query the history with T-SQL
Join sys.query_store_query_text, sys.query_store_query, sys.query_store_plan, sys.query_store_runtime_stats, and sys.query_store_runtime_stats_interval to relate text, query, plan, interval, and metrics. Keep the scope bounded; unrestricted history queries can be expensive and can expose sensitive query text.
What we can conclude
Query Store preserves two plans for the same query and relates them to intervals, executions, and metrics. In the test, one plan averages 4 reads and the other 521. This evidence supports a regression hypothesis; it does not replace workload context or make the faster plan a permanent decision.
A reasonable next check
The next entry turns an Analyze Actual Execution Plan scenario into a hypothesis that can be tested with the plan, its properties, and the metrics already collected.