
Guided analysis of a reproducible business query
An optimization ends when we can explain what the business needed, what work SQL Server performed, what changed, and what still requires verification. This case follows the complete process without claiming more than one controlled execution proves.
Define the result before reading the plan
We need the most recent order in Confirmado or Enviado state for every customer from 1 through 500. The result must include the customer, order, date, state, and total.
“Most recent” needs a tie-breaker. Date is sorted descending and, when two orders share a date, the greater IdPedido wins. That second key makes the selection deterministic: the same data produces the same selected row.
The received query first separates customers and then searches for one order per customer:
DECLARE @ClienteHasta int = 500;

WITH Clientes AS
(
    SELECT DISTINCT p.IdCliente
    FROM dbo.PedidoLaboratorio AS p
    WHERE p.IdCliente BETWEEN 1 AND @ClienteHasta
)
SELECT
    c.IdCliente,
    ult.IdPedido,
    ult.FechaPedido,
    ult.Estado,
    ult.Total
FROM Clientes AS c
CROSS APPLY
(
    SELECT TOP (1)
        p.IdPedido,
        p.FechaPedido,
        p.Estado,
        p.Total
    FROM dbo.PedidoLaboratorio AS p
    WHERE p.IdCliente = c.IdCliente
      AND p.Estado IN ('Confirmado', 'Enviado')
    ORDER BY p.FechaPedido DESC, p.IdPedido DESC
) AS ult
ORDER BY c.IdCliente
OPTION (RECOMPILE);
CROSS APPLY lets the right-hand query use the customer from the left-hand row. TOP (1) keeps the first order under the stated ordering. Together they express the contract correctly; they do not yet tell us how much work it requires.
Preserve a baseline
A baseline keeps the result, reads, timings, and plan from the same execution. It cannot be replaced by the impression that a query “feels slow.”
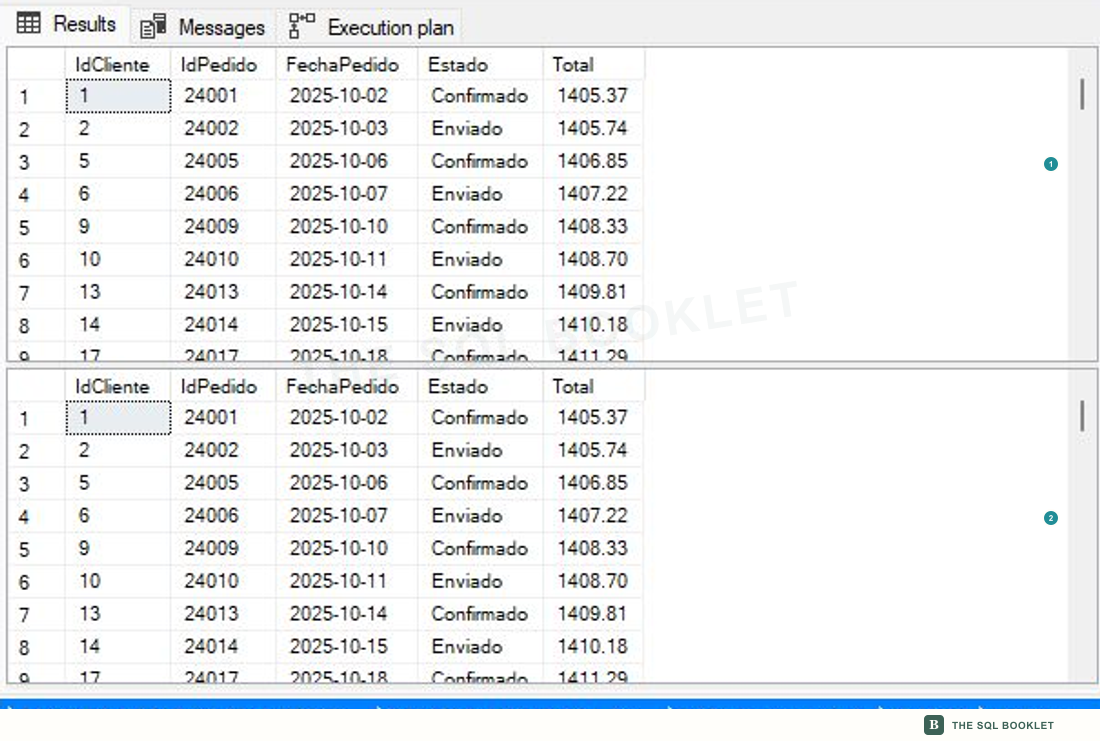
- 1Original query
The first grid keeps one relevant order per customer.
- 2Alternative
The second grid begins with the same rows and columns; full equivalence is verified separately.
A sample helps us recognize the result, but it does not prove that all 250 rows match. The exhaustive comparison comes before accepting the change.
Measure before explaining
The original query recorded activity against both the table and an internal work structure:
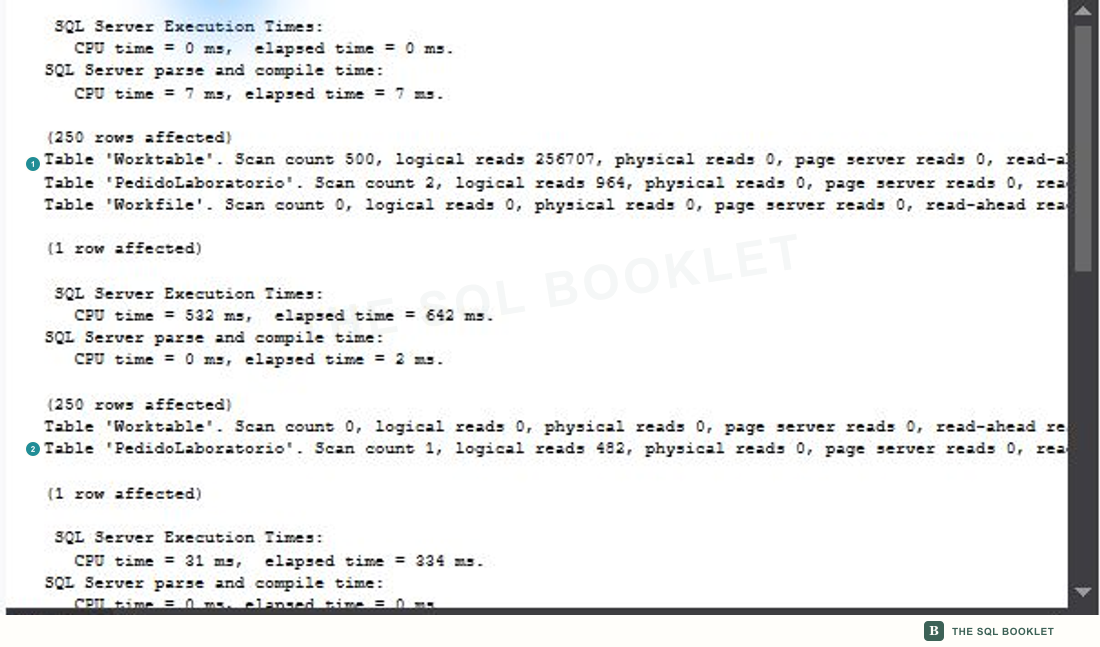
- 1Original query
Worktablerecords 500 scans and 256,707 logical reads; the table records 964 reads. - 2Alternative
Worktablefalls to zero and the table records 482 logical reads.
Worktable is an internal structure that SQL Server uses for temporary execution work. It is not a model table that we should query or delete. Its activity indicates that the plan needed to materialize or reorganize information outside the permanent structures.
In this execution, the original used 532 ms of CPU and 642 ms elapsed; the alternative used 31 ms and 334 ms. Those timings belong to this computer and this moment. Reads and temporary work offer a more stable basis for the explanation, but they also need repetition with representative parameters.
Read the original strategy
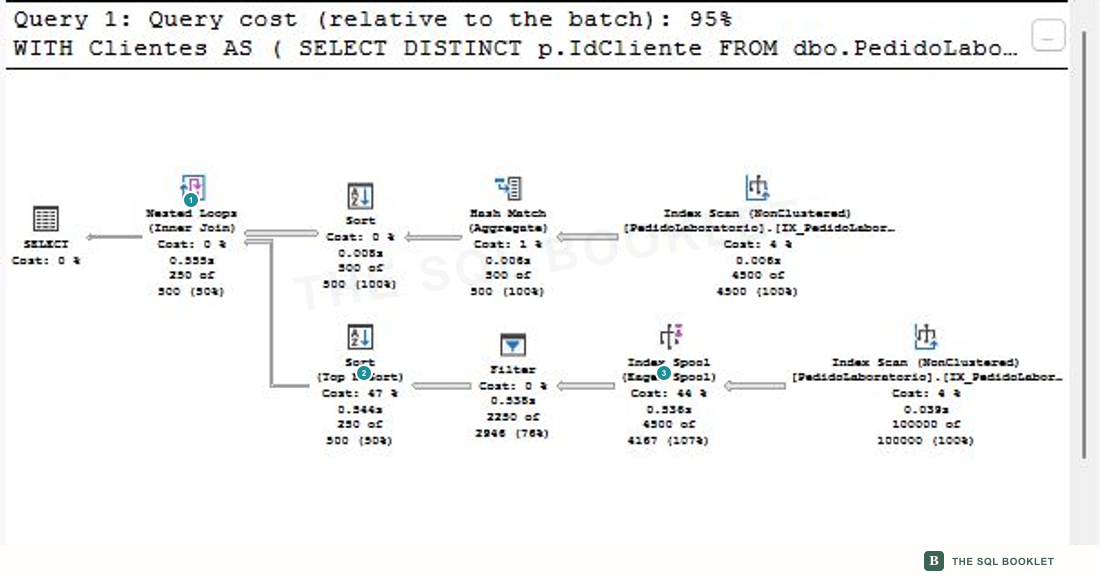
- 1Nested Loops
Coordinates an outer customer input with an inner lookup for every row received.
- 2Top N Sort
Orders candidates so
TOP (1)can keep the most recent order. - 3Index Spool
Temporarily stores rows in an indexed structure that the inner branch can reuse.
Nested Loops is not slow by definition, and a Spool is not automatically an error. Their relationship matters here: the inner branch is requested per customer, orders candidates, and uses a temporary structure. That shape agrees with the 500 Worktable scans observed in Messages.
The observation produces a bounded hypothesis: if all relevant orders are ranked once and the first one per customer is then retained, the result may stay the same with less temporary work. The hypothesis predicts fewer reads; it must still prove equivalence.
Rank the set once
The alternative uses ROW_NUMBER():
DECLARE @ClienteHasta int = 500;

WITH PedidosClasificados AS
(
    SELECT
        p.IdCliente,
        p.IdPedido,
        p.FechaPedido,
        p.Estado,
        p.Total,
        ROW_NUMBER() OVER
        (
            PARTITION BY p.IdCliente
            ORDER BY p.FechaPedido DESC, p.IdPedido DESC
        ) AS rn
    FROM dbo.PedidoLaboratorio AS p
    WHERE p.IdCliente BETWEEN 1 AND @ClienteHasta
      AND p.Estado IN ('Confirmado', 'Enviado')
)
SELECT
    IdCliente,
    IdPedido,
    FechaPedido,
    Estado,
    Total
FROM PedidosClasificados
WHERE rn = 1
ORDER BY IdCliente
OPTION (RECOMPILE);
A window function calculates a value over related rows without collapsing them into one row. ROW_NUMBER() assigns a sequence. PARTITION BY IdCliente restarts that sequence for every customer, and ORDER BY places the most recent order first; rn = 1 keeps that first position.
The rewrite is not correct merely because it looks shorter. It must also preserve customers, states, totals, and the tie-breaker.
Prove every row in both directions
Both outputs were stored in temporary tables and compared with EXCEPT from the original to the alternative and back again:

- 1No differences
Both variants return 250 rows, with no row exclusive to either direction.
EXCEPT returns rows from the first query that do not exist in the second. Running it in both directions catches missing and extra rows. Here, both zeros support that the alternative preserves the complete test result.
Repeat equivalence across several scopes
One boundary can still hide a special case. The same check was repeated, without changing either query, for three values of @ClienteHasta:

- 1Three preserved contracts
Scopes 50, 250, and 500 return 26, 126, and 250 rows in both variants.
SoloOriginalandSoloAlternativaremain zero.
This repetition broadens the equivalence evidence; it does not by itself prove that the alternative is faster for every parameter. Reads, plan shape, and timings must be measured again for each representative distribution.
Read the new plan without declaring victory
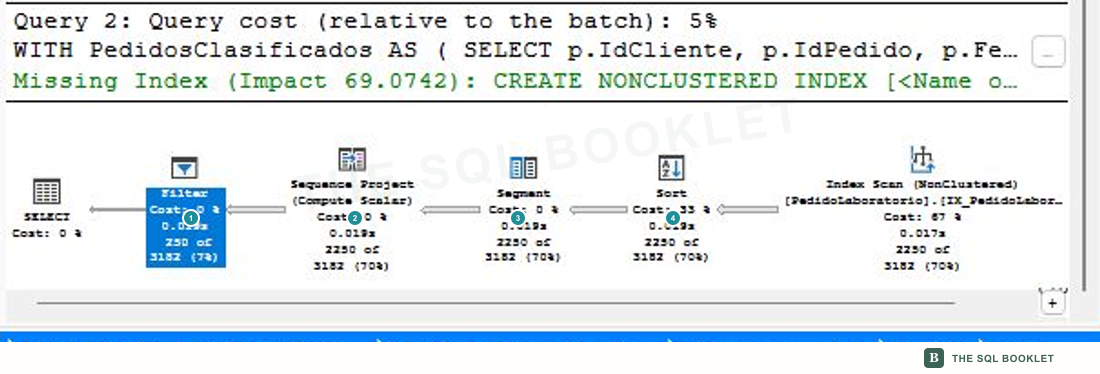
- 1Filter
Keeps rows whose calculated number equals one.
- 2Sequence Project
Produces the row number used by
ROW_NUMBER(). - 3Segment
Marks boundaries between customers so numbering can restart.
- 4Sort
Delivers rows in the order required by the window function.
The alternative processed 2,250 relevant orders and returned 250. It removed the observed Worktable activity, but it retains a Sort: ranking the set still has a cost.
The plan also shows a missing-index suggestion with an estimated impact of 69.0742 and estimates 3,181.98 rows where one operator returns 250. These are remaining signals, not instructions. The index suggestion needs a separate test covering writes, storage, and affected queries; the cardinality difference requires real statistics, parameters, and data distribution.
Conclude at the right scope
The evidence in this test supports three statements:
- both queries return the same 250 rows;
- the alternative removes the observed 500 scans and 256,707
Worktablelogical reads; PedidoLaboratorioreads fall from 964 to 482 in the representative execution.
It does not show that ROW_NUMBER() is always better than CROSS APPLY, that every Spool should be removed, or that the measured timings will repeat in production. A different distribution, index, or smaller customer range may favor another strategy.
Before transferring the change, we still need the text sent by the application, frequent and extreme parameters, customer and state distribution, current indexes and statistics, concurrency, blocking, write volume, available storage, and regressions across the complete workload.
Repeat the method with another query
Choose a business query and document, in this order:
- the exact result contract;
- a baseline with plan, reads, and timings;
- an observation that can be verified;
- a hypothesis that predicts a measurable change;
- an alternative and a two-way equivalence test;
- a new measurement under the same conditions;
- the remaining signals and production information that is still missing.
If you cannot explain what result must be preserved or what evidence would refute the hypothesis, the analysis is not ready to propose a change.
Related topics
- From a slow query to a testable hypothesis: separate observation, provisional cause, and prediction.
- Evaluate a change without optimizing for one execution: compare parameters and repetitions before generalizing.
- Build a repeatable baseline: preserve comparable conditions and measurements.
- Operator map: identify each node’s role before judging it.
- Read a missing-index suggestion: treat the green line as a candidate, not an order.