
From a slow query to a testable hypothesis
A slow query is a symptom. Turning it into a useful investigation requires preserving the query, gathering evidence, and writing an explanation that can fail. The first signal in the plan is not yet the cause.
Preserve the query that produced the symptom
The query summarizes one day of orders by status:
DECLARE @TargetDate DATE = '2025-12-30';

SET STATISTICS IO ON;
SET STATISTICS TIME ON;

SELECT
    p.Estado,
    COUNT_BIG(*) AS Orders,
    SUM(p.Total) AS TotalAmount
FROM dbo.PedidoLaboratorio AS p
WHERE YEAR(p.FechaPedido) = YEAR(@TargetDate)
  AND MONTH(p.FechaPedido) = MONTH(@TargetDate)
  AND DAY(p.FechaPedido) = DAY(@TargetDate)
GROUP BY p.Estado
ORDER BY TotalAmount DESC;

SET STATISTICS IO OFF;
SET STATISTICS TIME OFF;
Enable Include Actual Execution Plan with Ctrl+M before running it. Keep the Results, Messages, and Execution plan tabs together: each answers a different question.
- Results: what the query returned.
- Messages: how much read work and time that execution recorded.
- Execution plan: which operators SQL Server ran and how many rows moved through them.
Confirm the result first

- 1Reference result
The date returns 68 shipped orders and 68 pending orders. Any equivalent alternative must preserve these values.
A correct result does not prove that access is efficient. It does establish a condition no proposal may break: a variant that changes counts or amounts answers a different query.
Gather evidence about the work
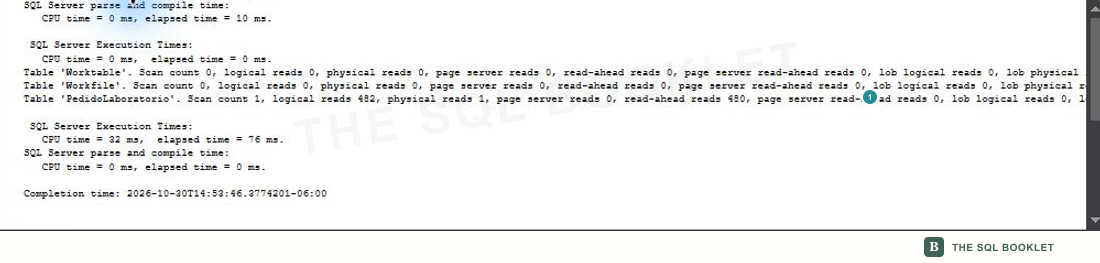
- 1Read work
PedidoLaboratoriorecords 482 logical reads for this execution.
A logical read is one 8 KB page requested from the data cache. It is not one row and does not by itself mean that a physical disk read occurred. The value is a baseline for this query and these parameters.
The same execution recorded 32 ms of CPU time and 76 ms of elapsed time. One timing is not a trend: cache state, compilation, concurrent activity, and clock resolution can change it. The hypothesis therefore also uses reads, rows, and operators.
Walk the plan and choose one signal

- 1Data access
The tree begins with an
Index Scanon the index whose key isFechaPedido.
The tree also contains Hash Match (Aggregate) to form the groups and Sort to order the amounts. Those operators answer requirements in the query. The initial access is the signal selected for investigation because the query filters on the same column that leads the index, yet the plan traverses it with a Scan.
An Index Scan traverses index pages and evaluates the rows it finds. It is not an error by definition: it can be appropriate when a broad part of the structure is needed. It matters here because the requested date represents a small fraction of the table.
Open properties before explaining
Select the Index Scan and press F4. The operator properties separate the rows it examined from the rows it passed to the next node.
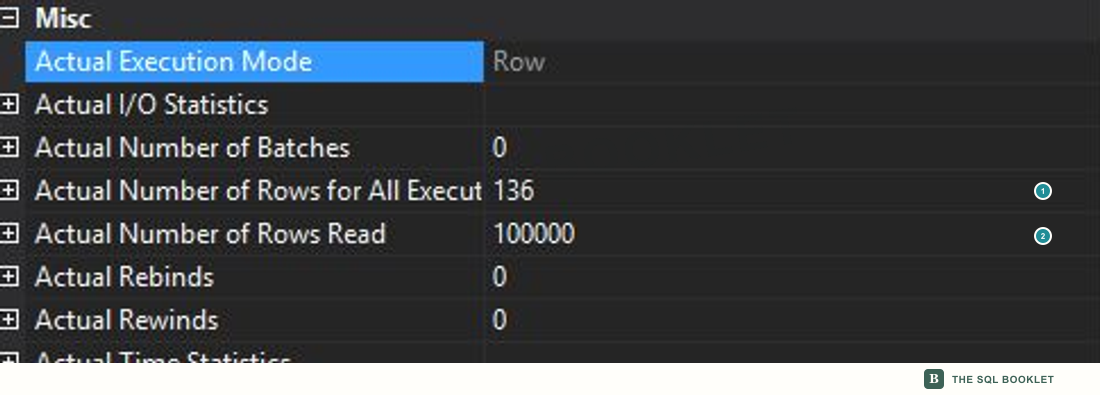
- 1Rows returned
Actual Number of Rows for All Executions = 136: these are the rows that match the requested date. - 2Rows examined
Actual Number of Rows Read = 100000: the operator checked the entire structure before returning those 136 rows.
The difference does not by itself prove why the traversal occurred. It does define the problem: the operator reads far more rows than it contributes to the rest of the plan.
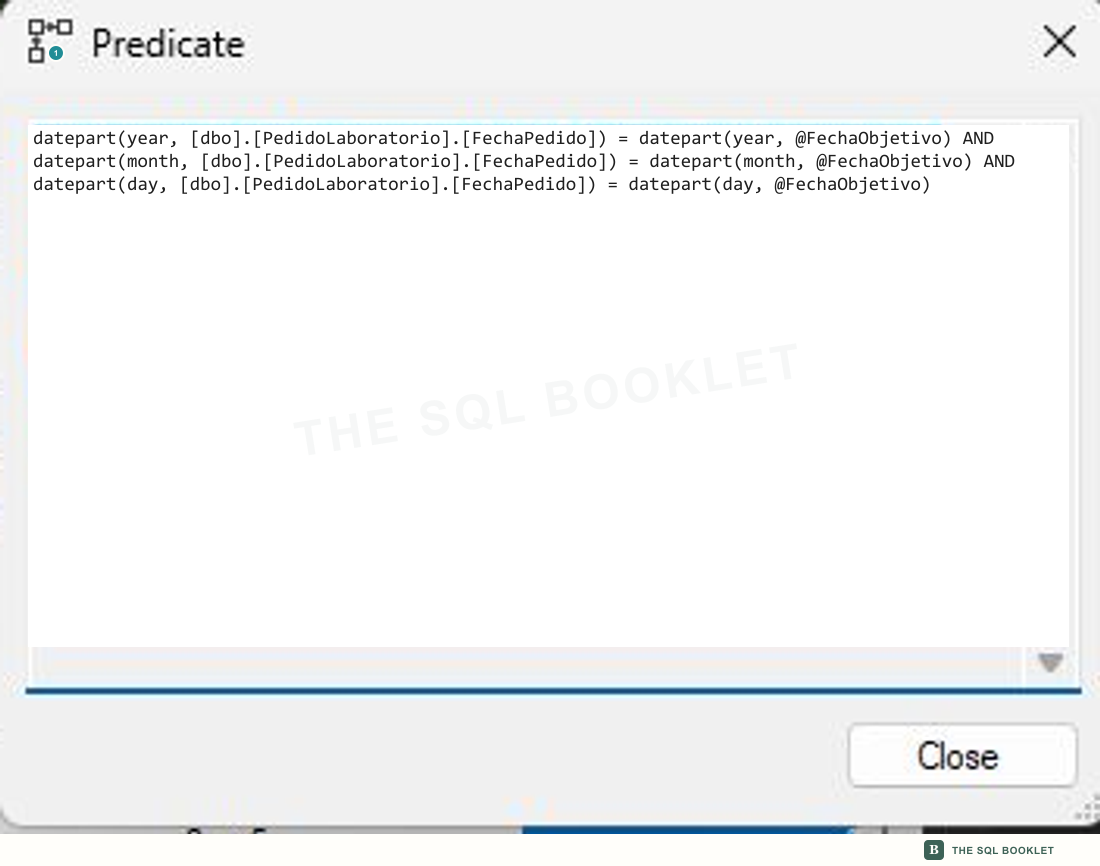
- 1Condition applied during the traversal
SSMS shows three
datepartcomparisons corresponding toYEAR,MONTH, andDAY.
The predicate is the condition that decides which rows pass through the operator. Here it transforms FechaPedido before comparing it; the capture preserves the real SSMS window and replaces only the internal database name.
Separate observation from hypothesis
The observations can be verified directly:
- the result contains 136 orders, split 68 and 68;
- the query records 482 logical reads;
- the access is an
Index Scan; - the operator reads 100,000 rows and returns 136;
- the predicate applies functions to
FechaPedido.
The provisional explanation is different:
Applying
YEAR,MONTH, andDAYto the column prevents SQL Server from turning the condition into a direct range on theFechaPedidokey, so it traverses the index and evaluates every row.
This explanation is a hypothesis, not a confirmed cause. To be testable, it needs both a prediction and a way to refute it.
Write a prediction that can fail
The candidate alternative expresses the same day as a half-open range:
WHERE p.FechaPedido >= @TargetDate
  AND p.FechaPedido < DATEADD(DAY, 1, @TargetDate)
A half-open range includes the starting boundary and excludes the next one. It therefore preserves every time within the chosen day without requiring FechaPedido to end at midnight.
The prediction is concrete: if the functions on the column explain the traversal, the range must preserve the result and reduce rows and pages read through more direct access. The hypothesis loses support if the result changes, if the operator still reads a similar proportion of the table, or if the reduction does not repeat for other dates.
Define the test without running it yet
The next entry’s comparison will preserve:
- the same projection, grouping, and ordering;
- the same dates for both variants;
- the actual plan,
SET STATISTICS IO, andSET STATISTICS TIME; - one warm-up execution and several measured executions;
- results, logical reads, rows read, plan, CPU, and elapsed time;
- the same index and data state during each pair.
Only the predicate form will change. That restriction connects the observed difference to one specific modification instead of mixing it with another index, different data, or a different query.
Next reasonable check
The next entry will run the test for several dates and compare the observed distributions. The objective will not be to win one execution, but to decide whether the evidence supports the hypothesis without changing the result.
Related topics
- Build a repeatable baseline: preserve context, query, and measurements before comparing.
- Reads with SET STATISTICS IO: interpret pages requested during execution.
- Estimated rows and actual rows: distinguish prediction from observed work.
- Index Seek, Index Scan, and Table Scan: recognize the ways rows are accessed.