
How Showplan XML is organized
The SSMS graphical plan is built from an XML document. The graphic makes orientation easier; the XML preserves the complete structure, the attributes of each operator, and, for an actual plan, the measurements observed during execution.
How to open the XML for the same plan
Enable Include Actual Execution Plan with Ctrl+M, run the query, and open Execution plan. Right-click an empty area of the canvas and choose Show Execution Plan XML. SSMS opens the document in another tab; keep the graphical tab open so the nodes can be related.
To return from a specific operator, select it in the graphic and press F4. Node ID in Properties corresponds to the NodeId attribute of a RelOp element in the XML. Opening XML from another plan or execution may produce different identifiers and measurements.
This query produces the plan used in the captures:
SELECT
    p.IdPedido,
    p.IdCliente,
    p.FechaPedido,
    p.Total
FROM dbo.PedidoLaboratorio AS p
WHERE p.IdPedido BETWEEN 100 AND 200
OPTION (MAXDOP 1);
The graphic and the XML describe the same plan
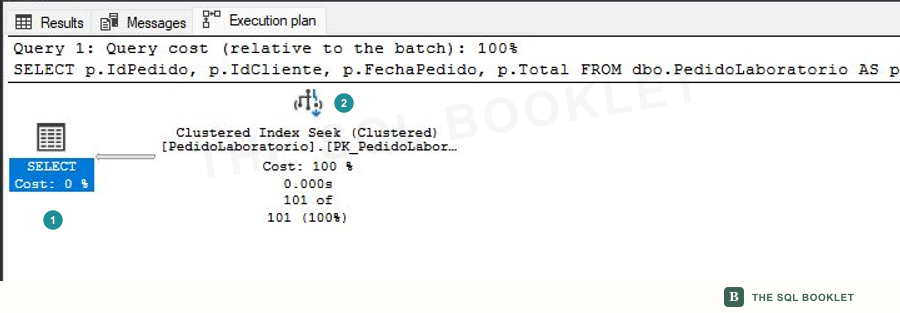
- 1Statement result
SELECTreceives the rows produced by the tree and represents the plan output. - 2Access operator
Clustered Index Seeklocates the requested range inside the clustered index.
The XML does not add a second plan. It describes these same nodes through nested elements. An XML element is a section delimited by a tag, such as <RelOp>. An attribute is a value written inside the opening tag, such as NodeId="0".
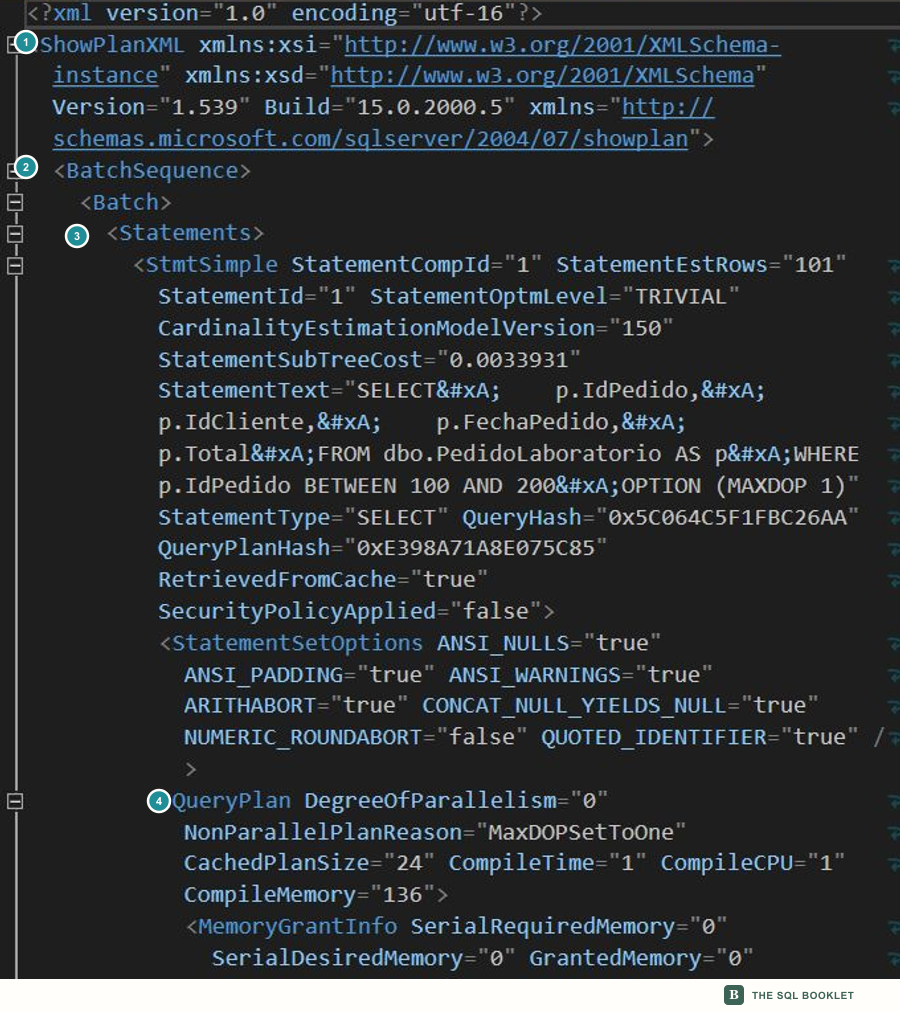
The hierarchy leads from the document to each operator
- 1
ShowPlanXMLThe root element declares the Showplan format and the version used to describe the document.
- 2
BatchSequenceGroups the batches included in the plan. A batch is the set of statements sent to SQL Server together.
- 3
StatementsContains the compiled statements in the batch. Each statement keeps its own data and plan.
- 4
QueryPlanContains the tree, compilation information, memory, statistics used, and other data for that statement plan.
The hierarchy is read from the outside inward:
ShowPlanXML
└── BatchSequence
    └── Batch
        └── Statements
            └── StmtSimple
                └── QueryPlan
                    └── RelOp
Not every plan has a single statement or operator. A batch can contain several statements, and each tree can nest as many RelOp elements as the chosen strategy requires.
The RelOp element is shown in greater detail in the operator-specific capture later in this entry.
StmtSimple identifies the compiled statement
StmtSimple preserves data for an individual statement. The capture includes, among others:
StatementText: the text sent to SQL Server;StatementEstRows: the estimated output rows for the statement;StatementSubTreeCost: the estimated cost of the complete tree;StatementOptmLevel: the optimization level applied;QueryHashandQueryPlanHash: calculated identifiers that help group comparable queries or plans.
A hash is a value calculated from other information. It is a practical identifier for grouping or comparison, but it does not replace the text, context, or plan measurements.
StatementText can contain object names, literals, and parameters. A .sqlplan file must therefore be reviewed before it is shared, even when the purpose is only to study its structure.
NodeId connects the operator to its properties
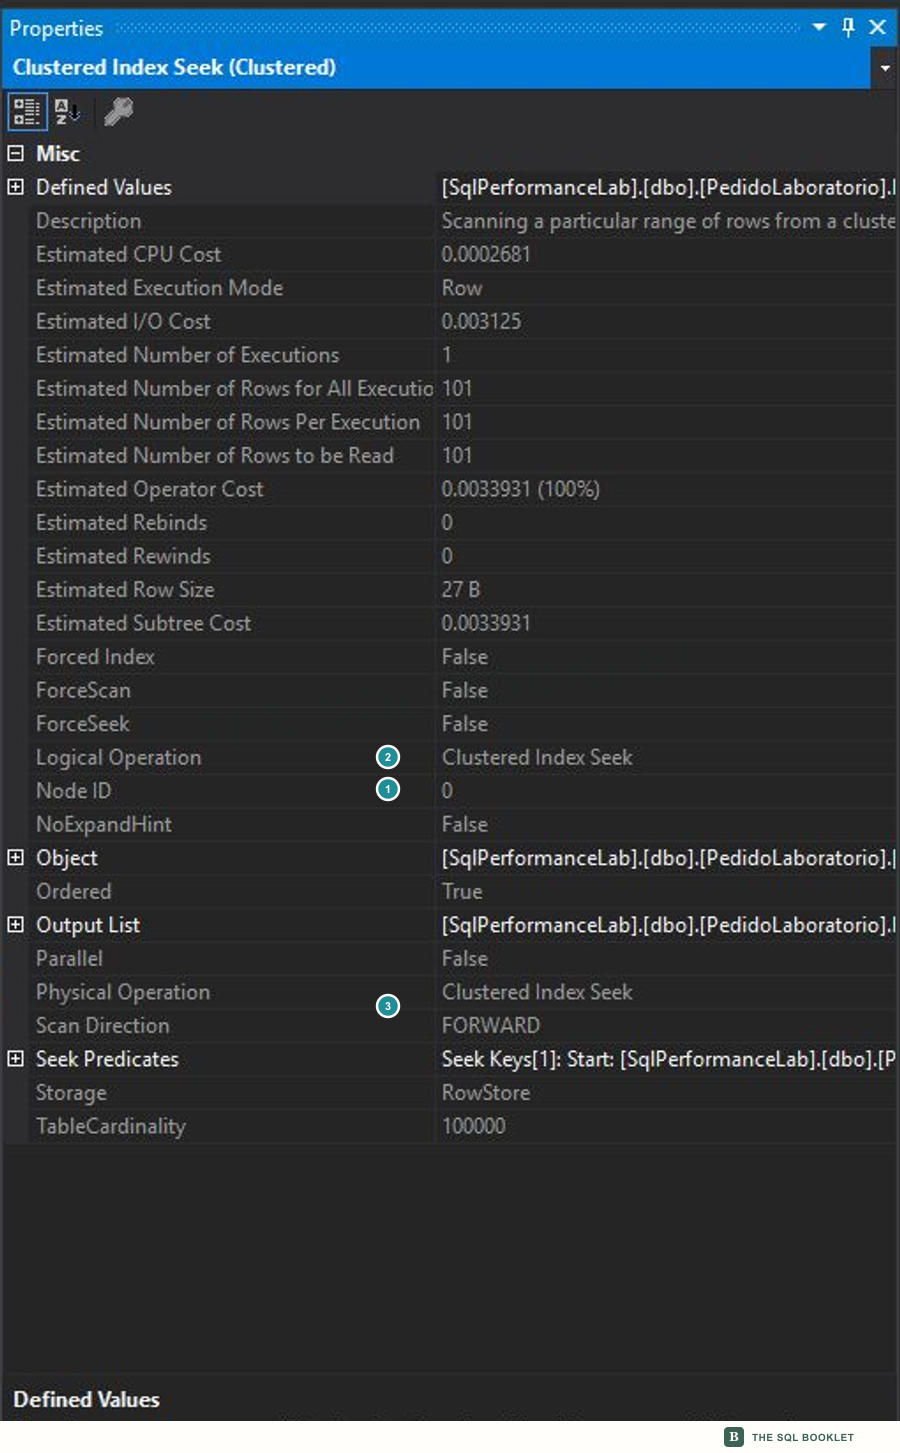
When a graphical-plan node is selected, the Properties panel exposes its values:
- 1
Node IDIdentifies the node inside this plan. The value can be used to locate the same operator in the XML.
- 2Logical operation
Describes the requested relational task, such as locating rows through an index.
- 3Physical operation
Names the algorithm SQL Server uses to perform that task.
The identifier belongs to the open document. It is not a permanent query number: another compilation can produce a different tree and assign different identifiers.
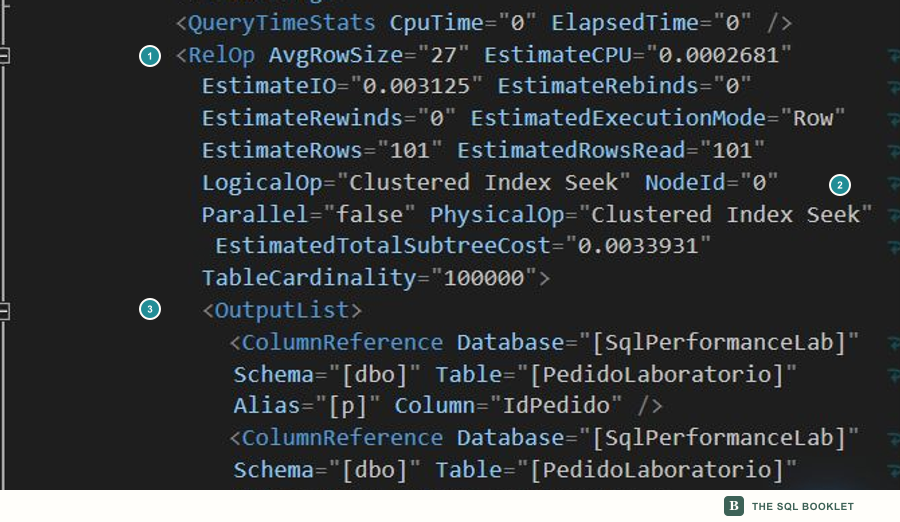
RelOp contains the node identity and estimates
- 1
RelOpelementThe opening tag contains row, CPU, input/output, execution, and subtree-cost estimates.
- 2Operator identity
LogicalOp,NodeId, andPhysicalOpidentify the task represented by the node and how it is implemented. - 3
OutputListLists the columns delivered to the operator consumer. It does not represent every column available in the object being read.
Inside RelOp, operator-specific elements appear. Here, IndexScan describes index access even though the visible physical operation is Clustered Index Seek; its children preserve the object, defined columns, and the predicate used to locate the range.
The actual plan adds observed measurements
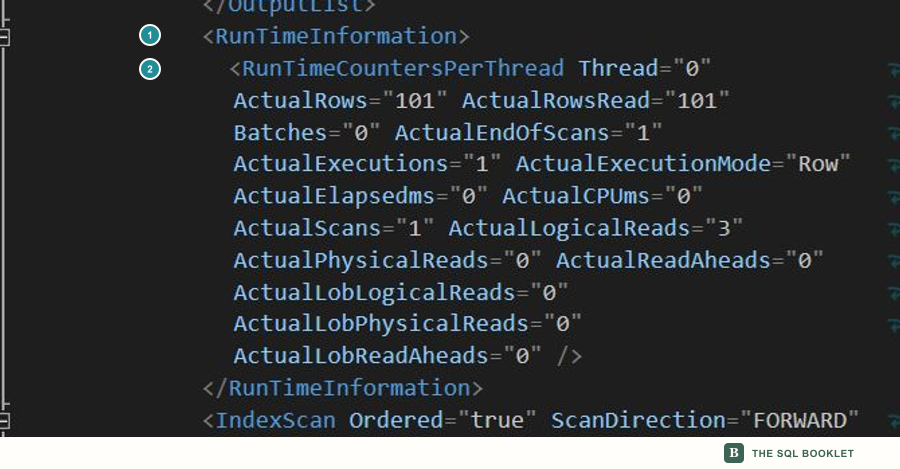
- 1
RunTimeInformationGroups evidence produced during execution. This element is absent from the estimated plan for the same query.
- 2
RunTimeCountersPerThreadPreserves observed rows, executions, reads, and times for one worker. A parallel operator can include more than one entry.
In this execution, ActualRows="101" means the operator returned 101 rows and ActualRowsRead="101" means it read 101. Those values describe this particular execution. They do not prove that the query will behave the same way with different parameters, data, or load conditions.
A worker is the context that executes part of a plan. A serial plan commonly has one entry with Thread="0"; a parallel plan can have several, and the operator total must be understood from the complete set.
Some elements appear only when the condition exists
The XML can include Warnings, compiled and runtime parameters, memory grants, MissingIndex suggestions, and other sections. Their absence is also information: it means that document did not record the condition, not that the condition is impossible in every execution.
We do not add those elements to this query to complete a checklist. Warnings are studied with plans that actually produce them; index suggestions and their limits are examined later with a test prepared for that purpose.
What we can conclude
We can traverse the XML from the statement to an operator, connect NodeId with the Properties panel, and distinguish estimates from measurements that only an actual plan can provide.
We do not need to memorize the complete Showplan schema. Reading starts with a specific question: locate a statement, a node, a property, or a difference between estimated and observed behavior.
A reasonable next check
The next entry walks through Analyze Actual Execution Plan: how to select a statement, read its scenarios, and keep each proposal as a hypothesis that still requires verification.
Related
- Actions available in the SSMS graphical plan: open Properties, XML, saving, and comparison from the correct place.
- Estimated plans, actual plans, and live query statistics: distinguish the evidence each mode can contain.
- Arrows, properties, and execution counts: connect rows, executions, and flow.
- Execution-plan warnings that require investigation: interpret signals without turning them into conclusions.