
CPU and elapsed time with SET STATISTICS TIME
A slow query does not necessarily keep the processor busy for its entire duration. SET STATISTICS TIME separates CPU work from elapsed time and also reports how long parsing and compilation took.
Enable the measurement
The option applies to the current session and writes its output to Messages:
SET STATISTICS TIME ON;

SELECT SUM(CONVERT(DECIMAL(38, 4), p.Total * f.Factor)) AS TotalCalculado
FROM dbo.PedidoLaboratorio AS p
CROSS JOIN
(
    VALUES (1), (2), (3), (4), (5), (6), (7), (8)
) AS f(Factor)
OPTION (MAXDOP 1, RECOMPILE);

SET STATISTICS TIME OFF;
Run the complete block with F5 and open Messages. The Results grid contains the calculated value, while the timings appear under SQL Server parse and compile time and SQL Server Execution Times in Messages.
The numbers change between runs and machines. What is reproducible is their location and the separation between compilation, CPU, and elapsed time, not the exact milliseconds shown in the screenshot.
ON remains active for later statements on the same connection. Run OFF when the measurement is complete so the Messages tab does not mix timings from unrelated queries.
The test query deliberately adds calculations and returns one row. MAXDOP 1 limits this execution to one worker to make the first comparison between CPU and duration easier to read; it is not a general recommendation for production queries.
The output separates compilation from execution
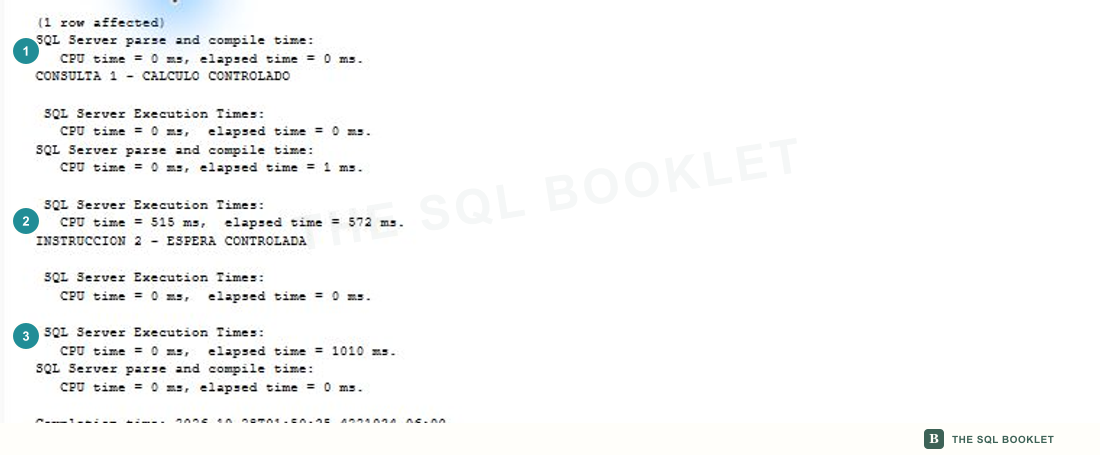
- 1Parsing and compilation
SQL Server parse and compile timereports work performed before the statement runs. The values in this test were 0 and 1 ms. - 2Controlled calculation
SQL Server Execution Timesreports 515 ms of CPU and 572 ms elapsed for the calculation query. - 3Controlled wait
The
WAITFORstatement reports 0 ms of CPU and 1010 ms elapsed. The processor was not doing work for most of that wait.
Validation statements and other parts of the batch may also produce groups with values close to zero. Relate each group to the statement that precedes it before interpreting a measurement.
parse and compile time: prepare the strategy
Before executing a query, SQL Server must parse the text and have a plan available. parse time applies to syntactic analysis; compile time includes the work required to compile or optimize the statement.
A value of 0 ms does not prove that no work occurred. The work may be below the counter’s resolution, the statement may be simple, or a reusable strategy may already be available. This test uses RECOMPILE to obtain a controlled compilation, not as a recommendation for every query.
CPU time: accumulated processor work
CPU time adds the time during which the query workers used a processor. It excludes time spent stopped while waiting for data, memory, locks, or other resources.
Here the query is restricted to one worker and reports 515 ms of CPU. In a parallel plan, several workers can consume CPU at the same time. Because their work is added together, total CPU can exceed elapsed time.
elapsed time: time from start to finish
elapsed time measures wall-clock time from the start of execution until it finishes. It includes CPU work and periods when the query does not progress because it is waiting for scheduling, storage, locks, or other resources.
The calculation reports 572 ms elapsed and 515 ms of CPU. That proximity describes this execution, but it does not identify where every millisecond was spent or allow the result to be extrapolated to a different workload.
A wait can take time without consuming CPU
The second statement isolates that difference:
WAITFOR DELAY '00:00:01';The wait lasts about one second and reports 0 ms of CPU. WAITFOR is used only as a teaching contrast here; it is not an optimization technique or a simulation of every wait a real query can encounter.
A large difference between elapsed time and CPU indicates time when the query was not actively using the processor. Other evidence—such as waits, blocking, reads, and the execution plan—is still required to establish the cause.
One execution does not establish a trend
Duration can change with cache state, compilation, parameters, the selected plan, concurrent activity, and available resources. A first execution provides an observation; it is not enough to declare an improvement or a regression.
A useful comparison preserves the query, parameters, and relevant conditions, repeats the measurement, and records the variation. It also distinguishes server time from any additional time an application may spend transferring and processing results.
What we can conclude
In this test, the calculation used 515 ms of CPU over 572 ms elapsed. The controlled wait used 0 ms of CPU over 1010 ms elapsed. The values show that CPU and duration answer different questions; they do not explain the cause of a performance problem on their own.
A reasonable next check
The next entry builds a repeatable baseline: preserve the test conditions, collect several executions, and compare one variable at a time.