
Execution plan warnings that require investigation
A yellow triangle draws attention to a condition SQL Server identified while compiling or executing a query. The warning identifies where to look; by itself, it does not prove what caused a delay or prescribe a correction.
Before reacting, distinguish what the engine detected, when it could detect it, and what additional evidence is needed. An implicit conversion belongs to the compiled expression; a spill to tempdb describes something that happened during execution. They are not interpreted in the same way.
Where a warning appears
SSMS displays the triangle on the related operator or on the root SELECT operator. Pointing to that location reveals a Warnings section with the available detail. The operator can also be selected and inspected through the Properties window with F4.
To reproduce the screenshots in this article, enable Include Actual Execution Plan with Ctrl+M and run each case separately. Then open Execution plan; the warning triangle does not appear in Results or Messages. Some warnings are recorded only in an actual plan because they depend on what happened during execution.
The root operator represents the complete statement. A warning placed there may refer to an expression farther along the tree; read its text before attributing it to the icon that contains it.
Implicit conversion
An implicit conversion occurs when SQL Server must bring two values to a compatible type even though the query did not write the conversion explicitly. Data type precedence decides which value is transformed: when the types have different priorities, SQL Server converts the lower-precedence type to the higher-precedence type.
In this test, Estado is VARCHAR(20) and the variable is NVARCHAR(20):
DECLARE @Estado NVARCHAR(20) = N'Pendiente';

SELECT COUNT_BIG(*) AS Pedidos
FROM dbo.PedidoLaboratorio AS p
WHERE p.Estado = @Estado
OPTION (RECOMPILE);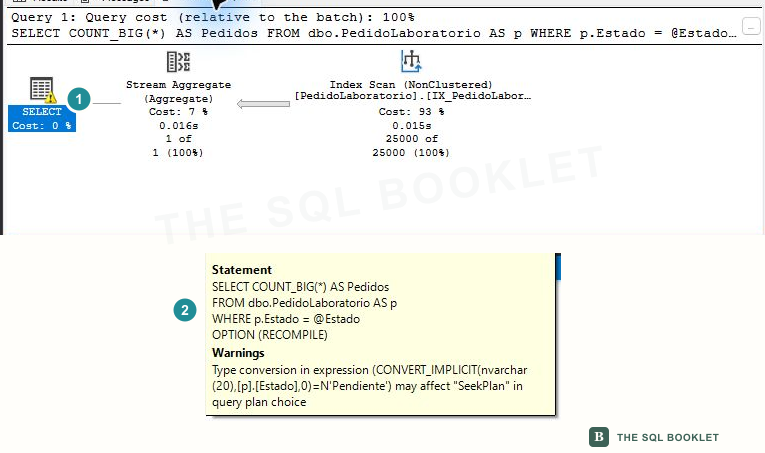
- 1Warning indicator
The triangle appears on SELECT. Its location identifies the statement containing the signal; the detail still needs to be opened.
- 2Converted expression
Warnings shows CONVERT_IMPLICIT on p.Estado and reports that it may affect a Seek alternative.
The observation is specific: the plan converted p.Estado from VARCHAR to NVARCHAR and recorded PlanAffectingConvert. The query read all 100,000 rows of the scanned index and supplied 25,000 to the aggregate.
That does not yet prove that the conversion caused the Scan. The table used for this test has no index whose key begins with Estado; without that path, aligning the types does not guarantee that a Seek will appear. The hypothesis must be tested with the actual structures and volume.
Aligning the comparison types
The query can be repeated with a variable that preserves the column’s type:
DECLARE @Estado VARCHAR(20) = 'Pendiente';

SELECT COUNT_BIG(*) AS Pedidos
FROM dbo.PedidoLaboratorio AS p
WHERE p.Estado = @Estado
OPTION (RECOMPILE);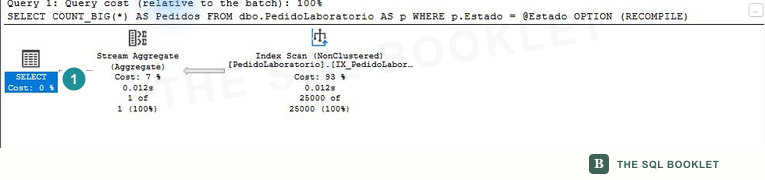
- 1No conversion warning
SELECTno longer shows the triangle, and the plan does not reportPlanAffectingConvert. TheIndex Scanremains because aligning the types removed the conversion but did not create an access path onEstado.
The check does not end when the triangle disappears: compare the plan, rows read, and metrics. Also inspect why the application or procedure sent a different type, because correcting one query may leave the same inconsistent contract in other calls.
Memory grant
A memory grant is execution memory reserved for operators such as Sort, hash joins, and hash aggregates. The optimizer calculates the request from the estimated row count and size; at execution time, SQL Server grants the available amount within its limits.
The root operator can expose values such as:
- Requested Memory: the amount requested to run the plan;
- Granted Memory: the amount granted;
- Max Used Memory: the maximum used during that execution.
A large grant is not automatically excessive, and a small one is not automatically efficient. Relate it to volume, concurrency, observed use, and possible memory waits.
The following query sorts 100,000 rows to calculate ROW_NUMBER. In the unrestricted execution, it requested and received 8,752 KB, used at most 5,512 KB, and did not spill data:
SELECT SUM(q.Posicion) AS SumaPosiciones
FROM
(
    SELECT ROW_NUMBER() OVER
    (
        ORDER BY
            p.Total DESC,
            p.IdPedido
    ) AS Posicion
    FROM dbo.PedidoLaboratorio AS p
) AS q
OPTION (MAXDOP 1, RECOMPILE);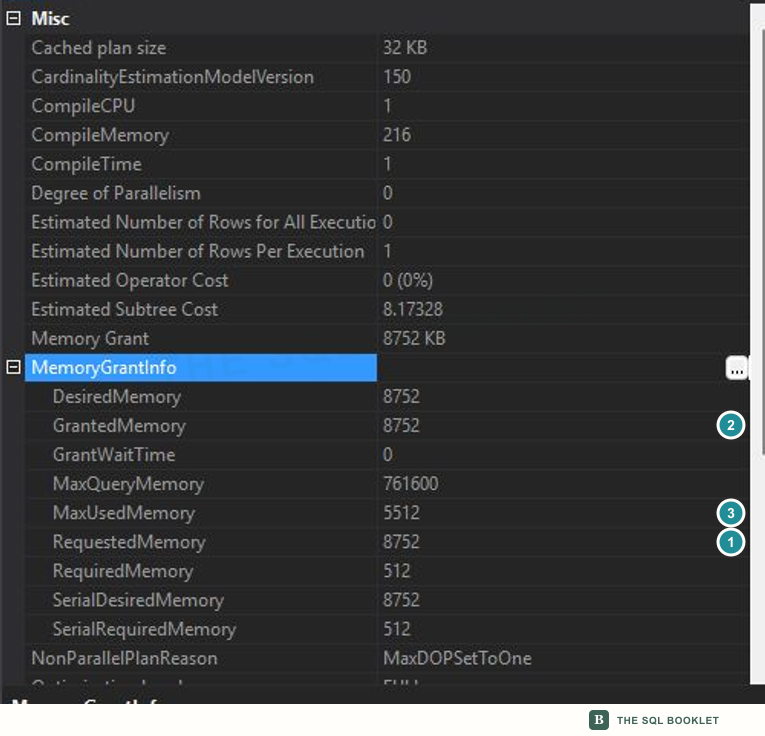
- 1Requested memory
RequestedMemoryrecords a request of 8,752 KB. - 2Granted memory
GrantedMemoryshows that SQL Server granted 8,752 KB. - 3Maximum observed use
MaxUsedMemoryrecords 5,512 KB during this execution.
Those values describe this execution on SQL Server 2019 Express. They are not general thresholds for another instance.
Spill to tempdb
A spill occurs when a sort or hash operator cannot keep all its work within the granted memory and uses tempdb as auxiliary space. tempdb is the system database SQL Server uses for temporary results and structures.
To observe it reproducibly, this test deliberately limits the same query’s grant:
SELECT SUM(q.Posicion) AS SumaPosiciones
FROM
(
    SELECT ROW_NUMBER() OVER
    (
        ORDER BY
            p.Total DESC,
            p.IdPedido
    ) AS Posicion
    FROM dbo.PedidoLaboratorio AS p
) AS q
OPTION
(
    MAX_GRANT_PERCENT = 0.1,
    MAXDOP 1,
    RECOMPILE
);
MAX_GRANT_PERCENT is used here only to produce the teaching case. It is not proposed as a correction for a real query.
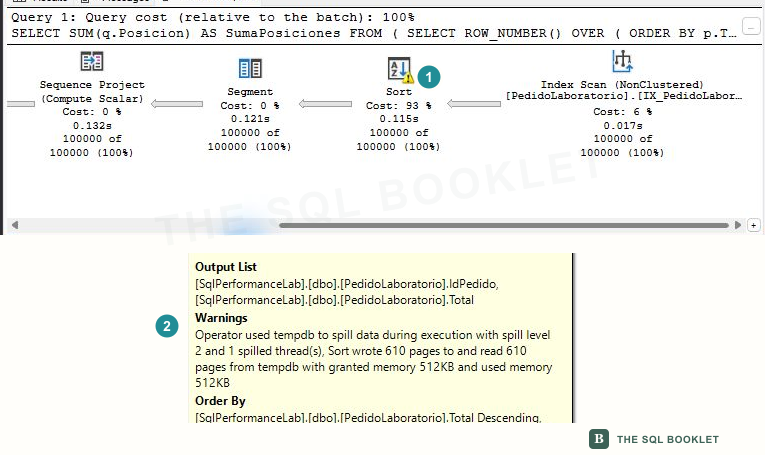
- 1Operator that spilled
The triangle is on Sort. The warning belongs to that ordering work, not to every operator in the plan.
- 2Execution evidence
Warnings records level 2, one affected thread, 610 pages written to and read from tempdb, and a used grant of 512 KB.
The spill appears in the actual plan because it depends on what happened during execution. An estimated plan can show the Sort and its calculated memory, but it cannot state that a future execution wrote to tempdb.
The observation does not choose the correction either. Investigate why the grant was insufficient: estimates, row width, volume, an imposed limit, concurrent pressure, or environmental changes. Removing a Sort, increasing memory, or adding an index without that check can move the cost elsewhere.
Missing or outdated statistics
Statistics describe the value distribution the optimizer uses to estimate rows. A missing-statistics warning means a useful statistic was unavailable during compilation. Check AUTO_CREATE_STATISTICS, AUTO_UPDATE_STATISTICS, permissions, read-only state, and the named object.
Outdated statistics do not always produce a triangle. They can be found by comparing estimated and actual rows, reviewing the update date, and observing how many modifications occurred afterward. The absence of a warning does not prove that the estimates are sufficient.
sys.stats lists the object’s statistics. sys.dm_db_stats_properties adds the update date, recorded row count, and subsequent modification counter for each one:
SELECT
    s.name,
    sp.last_updated,
    sp.rows,
    sp.modification_counter
FROM sys.stats AS s
CROSS APPLY sys.dm_db_stats_properties
(
    s.object_id,
    s.stats_id
) AS sp
WHERE s.object_id = OBJECT_ID(N'dbo.PedidoLaboratorio')
ORDER BY s.name;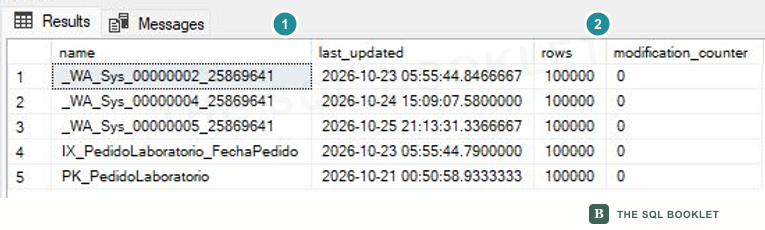
- 1Last update
last_updatedlocates when the information used by the optimizer was generated. - 2Subsequent modifications
modification_countercounts changes observed since that update. Interpret the value with the object's size and distribution, not as an isolated threshold.
Missing join predicate
A join without a predicate combines two inputs without a condition relating their rows. The condition in this test only compares a p1 column with itself; it contains no reference to p2 and therefore establishes no relationship between the two sides:
SELECT TOP (10)
    p1.IdPedido AS Pedido1,
    p2.IdPedido AS Pedido2
FROM dbo.PedidoLaboratorio AS p1
INNER LOOP JOIN dbo.PedidoLaboratorio AS p2
    ON p1.IdPedido = p1.IdPedido
OPTION (MAXDOP 1, RECOMPILE);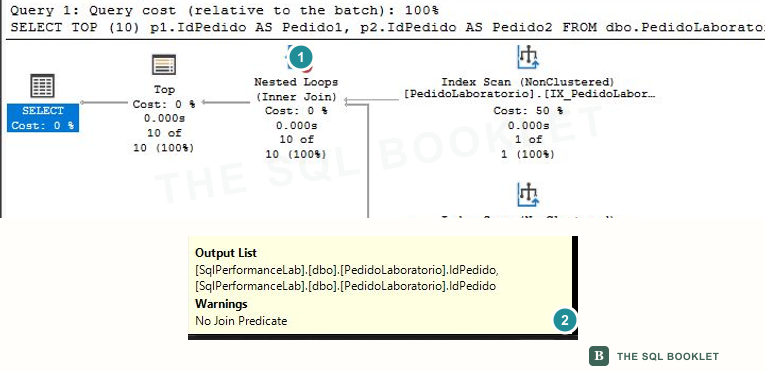
- 1Flagged operator
The triangle appears on
Nested Loops, the operator combining both inputs. - 2Warning detail
WarningsrecordsNo Join Predicatebecause the condition does not relate columns fromp1andp2.
The warning can reveal an error that multiplies rows or accompany an intentional Cartesian combination. TOP (10) limits the result returned in this test, but it does not turn the condition into a valid relationship. The SQL text and the expected result distinguish intent; the icon cannot do so by itself.
Separate signal, hypothesis, and verification
| Stage | Question |
|---|---|
| Observed signal | Which text, operator, values, and execution produced the warning? |
| Hypothesis | Which condition could explain that signal, and through which mechanism? |
| Verification | Which controlled comparison would confirm or reject that explanation? |
The investigation also preserves the query’s correct result. A change that removes the triangle but alters rows, ordering, concurrency, or stability is not a valid improvement.
Next reasonable check
The next article walks through the actions available in the SSMS graphical plan. It distinguishes actions opened from an operator from those that belong to the whole canvas, and explains what each one provides without treating it as an automatic diagnosis.
Related topics
- Estimated rows and actual rows: compare the prediction with execution.
- Sort, Segment, and Sequence Project: recognize the order required by a window.
- Stream Aggregate and Hash Match Aggregate: compare ordering and memory while forming groups.
- Spool: distinguish materialization from reuse.
- Review statistics age and modifications.
OPTIONand query hints: restrict decisions only after measuring.