
Calculate daily sales and accumulated total
Situation
We need a daily sales series and, next to each day, the amount accumulated since the beginning of the period. The first calculation reduces order lines to one row per day; the second uses those rows without reducing them again.
First approach
Trying to directly apply a window function on items makes it difficult to distinguish the day’s total from the accumulated one. First we will build the daily level and then calculate the window.
A window function calculates a value over related rows without combining them into a single row. In SUM(...) OVER (...), OVER defines those rows; frame ROWS BETWEEN UNBOUNDED PRECEDING AND CURRENT ROW starts at the first sorted row and ends at the row being read.
Before forming the daily series, CONVERT(DATE, pe.FechaPedido) preserves the date and removes the time part so that all orders on the same day belong to the same group.
Final query
DECLARE @Desde DATE = '20260301';
DECLARE @Hasta DATE = '20260401';

WITH VentasDiarias AS
(
    SELECT
        CONVERT(DATE, pe.FechaPedido) AS Fecha,
        SUM
        (
            d.Cantidad * d.PrecioUnitario
            * (1 - d.Descuento / 100.0)
        ) AS VentaDia
    FROM dbo.Pedido AS pe
    INNER JOIN dbo.PedidoDetalle AS d
        ON d.IdPedido = pe.IdPedido
    WHERE pe.Estado IN ('Confirmado', 'Enviado')
      AND pe.FechaPedido >= @Desde
      AND pe.FechaPedido <  @Hasta
    GROUP BY CONVERT(DATE, pe.FechaPedido)
)
SELECT
    v.Fecha,
    v.VentaDia,
    SUM(v.VentaDia) OVER
    (
        ORDER BY v.Fecha
        ROWS BETWEEN UNBOUNDED PRECEDING AND CURRENT ROW
    ) AS VentaAcumulada
FROM VentasDiarias AS v
ORDER BY v.Fecha;
How it works
The CTE, a named query available to the following statement, filters the period with an exclusive upper boundary and groups by date without time. VentaDia represents one row for each day with accepted orders.
The second sum uses OVER: it keeps those rows and accumulates from the first to the current one. Explicitly writing the ROWS framework makes it clear which rows are involved and avoids relying on implicit tie behavior.
Expected result
| Date | SaleDay | AccumulatedSale |
|---|---|---|
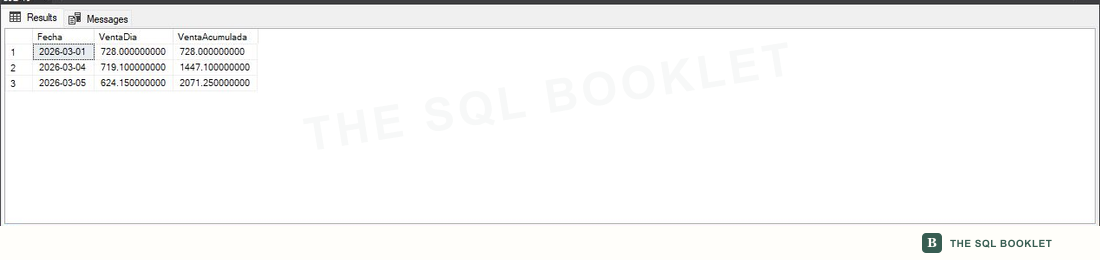
| 2026-03-01 | 728.00 | 728.00 |
| 2026-03-04 | 719.10 | 1447.10 |
| 2026-03-05 | 624.15 | 2071.25 |
Days without sales do not appear because there is no row to group.
Verified in SSMS
The grid shows how each daily sale contributes to the running total on the next row.
Variation: show days at zero
For a continuous chart, we need a calendar table—a table with one row per date and its attributes—or a controlled date sequence, plus a LEFT JOIN to VentasDiarias. We then turn absence into zero with COALESCE.
We can also add PARTITION BY to reset the accumulation by month, branch or currency.
Limits and cautions
The running total is meaningful only when the order is stable and the figures share the same unit. We do not add different currencies or mix canceled orders with accepted sales.
Converting the date column inside the filter can make efficient use of an index harder. An index organizes values to make rows easier to access. That is why WHERE compares the original column with boundaries and reserves conversion for grouping and presentation.